Cache Modelling TCG Plugin
Caches are a key way that enables modern CPUs to keep running at full speed by avoiding the need to fetch data and instructions from the comparatively slow system memory. As a result understanding cache behaviour is a key part of performance optimisation.
TCG plugins provide means to instrument generated code for both user-mode and full system emulation. This includes the ability to intercept every memory access and instruction execution. This post introduces a new TCG plugin that’s used to simulate configurable L1 separate instruction cache and data cache.
While different microarchitectures often have different approaches at the very low level, the core concepts of caching are universal. As QEMU is not a microarchitectural emulator we model an ideal caching system with a few simple parameters. By doing so, we can adequately simulate the behaviour of L1 private (per-core) caches.
Overview
The plugin simulates how L1 user-configured caches would behave when given a working set defined by a program in user-mode, or system-wide working set. Subsequently, it logs performance statistics along with the most N cache-thrashing instructions.
Configurability
The plugin is configurable in terms of:
- icache size parameters:
icachesize,iblksize,iassoc, All of which take a numeric value - dcache size parameters:
dcachesize,dblksize,dassoc. All of which take a numeric value - Eviction policy:
evict=lru|rand|fifo - How many top-most thrashing instructions to log:
limit=TOP_N - How many core caches to keep track of:
cores=N_CORES
Multicore caching
Multicore caching is achieved by having independent L1 caches for each available core.
In full-system emulation, the number of available vCPUs is known to the plugin at plugin installation time, so separate caches are maintained for those.
In user-space emulation, the index of the vCPU initiating memory access monotonically increases and is limited with however much the kernel allows creating. The approach used is that we allocate a static number of caches, and fit all memory accesses into those cores. This approximation is sufficiently similar to real systems since having more threads than cores will result in interleaving those threads between the available cores so they might thrash each other anyway.
Design and implementation
General structure
A generic cache data structure, Cache, is used to model either an icache or
dcache. For each known core, the plugin maintains an icache and a dcache. On a
memory access coming from a core, the corresponding cache is interrogated.
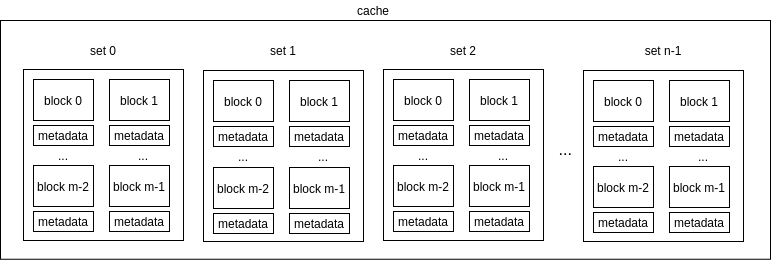
Each cache has a number of cache sets that are used to store the actual cached
locations alongside metadata that backs eviction algorithms. The structure of a
cache with n sets, and m blocks per sets is summarized in the following
figure:
Eviction algorithms
The plugin supports three eviction algorithms:
- Random eviction
- Least recently used (LRU)
- FIFO eviction
Random eviction
On a cache miss that requires eviction, a randomly chosen block is evicted to make room for the newly-fetched block.
Using random eviction effectively requires no metadata for each set.
Least recently used (LRU)
For each set, a generation number is maintained that is incremented on each memory access and. The current generation number is assigned to the block currently being accessed. On a cache miss, the block with the least generation number is evicted.
FIFO eviction
A FIFO queue instance is maintained for each set. On a cache miss, the evicted block is the first-in block, and the newly-fetched block is enqueued as the last-in block.
Usage
Now a simple example usage of the plugin is demonstrated by running a program that does matrix multiplication, and how the plugin helps identify code that thrashes the cache.
A program, test_mm uses the following function to carry out matrix
multiplication:
void mm(int n, int m1[n][n], int m2[n][n], int res[n][n])
{
    for (int i = 0; i < n; i++) {
        for (int j = 0; j < n; j++) {
            int sum = 0;
            for (int k = 0; k < n; k++) {
                int op1 = m1[i][k];
                int op2 = m2[k][j];
                sum += op1 * op2;
            }
            res[i][j] = sum;
        }
    }
}
Running mm_test inside QEMU using the following command:
./qemu-x86_64 $(QEMU_ARGS) \
  -plugin ./contrib/plugins/libcache.so,dcachesize=8192,dassoc=4,dblksize=64,\
      icachesize=8192,iassoc=4,iblksize=64 \
  -d plugin \
  -D matmul.log \
  ./mm_test
The preceding command will run QEMU and attach the plugin with the following configuration:
- dcache: cache size = 8KBs, associativity = 4, block size = 64B.
- icache: cache size = 8KBs, associativity = 4, block size = 64B.
- Default eviction policy is LRU (used for both caches).
- Default number of cores is 1.
The following data is logged in matmul.log:
core #, data accesses, data misses, dmiss rate, insn accesses, insn misses, imiss rate
0       4908419        274545          5.5933%  8002457        1005            0.0126%

address, data misses, instruction
0x4000001244 (mm), 262138, movl (%rdi, %rsi, 4), %esi
0x400000121c (mm), 5258, movl (%rdi, %rsi, 4), %esi
0x4000001286 (mm), 4096, movl %edi, (%r8, %rsi, 4)
0x400000199c (main), 257, movl %edx, (%rax, %rcx, 4)

...
We can observe two things from the logs:
- The most cache-thrashing instructions belong to a symbol called
mm, which happens to be the matrix multiplication function. - Some array-indexing instructions are generating the greatest share of data misses.
test_mm does a bunch of other operations other than matrix multiplication.
However, Using the plugin data, we can narrow our investigation space to mm,
which happens to be generating about 98% of the overall number of misses.
Now we need to find out why is the instruction at address 0x4000001224
thrashing the cache. Looking at the disassembly of the program, using
objdump -Sl test_mm:
/path/to/test_mm.c:11 (discriminator 3)
                int op2 = m2[k][j];  <- The line of code we're interested in
    1202:   8b 75 c0               mov    -0x40(%rbp),%esi
    1205:   48 63 fe               movslq %esi,%rdi
    1208:   48 63 f2               movslq %edx,%rsi
    120b:   48 0f af f7            imul   %rdi,%rsi
    120f:   48 8d 3c b5 00 00 00   lea    0x0(,%rsi,4),%rdi
    1216:   00
    1217:   48 8b 75 a8            mov    -0x58(%rbp),%rsi
    121b:   48 01 f7               add    %rsi,%rdi
    121e:   8b 75 c8               mov    -0x38(%rbp),%esi
    1221:   48 63 f6               movslq %esi,%rsi
    1224:   8b 34 b7               mov    (%rdi,%rsi,4),%esi
                                   ^^^^^^^^^^^^^^^^^^^^^^^^^
    1227:   89 75 d4               mov    %esi,-0x2c(%rbp)
It can be seen that the most problematic instruction is associated with loading
m2[k][j]. This happens because we’re traversing m2 in a column-wise order.
So if the matrix m2 is larger than the data cache, we end up with fetching
blocks that we only use one integer from and not use again before getting
evicted.
A simple solution to this problem is to transpose the second matrix and access it in a row-wise order.
By editing the program to transpose m2 before calling mm and run it inside
QEMU with the plugin attached and using the same configuration as previously,
the following data is logged in matmul.log:
core #, data accesses, data misses, dmiss rate, insn accesses, insn misses, imiss rate
0       4998994        24235           0.4848%  8191937        1009            0.0123%

address, data misses, instruction
0x4000001244 (mm), 16447, movl (%rdi, %rsi, 4), %esi
0x4000001359 (tran), 3994, movl (%rcx, %rdx, 4), %ecx
0x4000001aa7 (main), 257, movl %edx, (%rax, %rcx, 4)
0x4000001a72 (main), 257, movl %ecx, (%rax, %rdx, 4)

...
It can be seen that a minor number of misses is generated at transposition time
in tran. The rest of the matrix multiplication is carried out using the same
procedure but to multiply m1[i][k] by m2[j][k]. So m2 is traversed
row-wise and hence utilized cache space much more optimally.
Multi-core caching
The plugin accepts a cores=N_CORES argument that represents the number of
cores that the plugin must keep track of. Memory accesses generated by excess
threads will be served through the available core caches. The model is an
approximation, as described, and is most-akin to idealized behaviour when the
number of threads generated by the program is less than cores available,
otherwise inter-thread thrashing will invariably occur.
An example usage of the plugin using the cores argument to use 4 per-core
caches against a multithreaded program:
./qemu-x86_64 $(QEMU_ARGS) \
    -plugin ./contrib/plugins/libcache.so,cores=4 \
    -d plugin \
    -D logfile \
    ./threaded_prog
This reports out the following:
core #, data accesses, data misses, dmiss rate, insn accesses, insn misses, imiss rate
0       76739          4195          5.411666%  242616         1555            0.6409%
1       29029          932           3.211106%  70939          988             1.3927%
2       6218           285           4.511835%  15702          382             2.4328%
3       6608           297           4.411946%  16342          384             2.3498%
sum     118594         5709          4.811139%  345599         3309            0.9575%

...
Conclusion
By emulating simple configurations of icache and dcache we can gain insights into how a working set is utilizing cache memory. Simplicity is sought and L1 cache is emphasized since its under-utilization can be severe to the overall system performance.
This plugin is made as part of my GSoC participation for the year 2021 under the mentorship of Alex Bennée.
List of posted patches related to the plugin:
- [PATCH v4 0/5] plugins: New TCG plugin for cache modelling
- [PATCH v4 1/5] plugins: Added a new cache modelling plugin
- [PATCH v4 2/5] plugins/cache: Enable cache parameterization
- [PATCH v4 3/5] plugins/cache: Added FIFO and LRU eviction policies
- [PATCH v4 4/5] docs/devel: Added cache plugin to the plugins docs
- [PATCH v5] MAINTAINERS: Added myself as a reviewer for TCG Plugins
- [PATCH 1/6] plugins/cache: Fixed a bug with destroying FIFO metadata
- [PATCH 2/6] plugins/cache: limited the scope of a mutex lock
- [PATCH 6/6] plugins/cache: Fixed “function decl. is not a prototype” warnings
- [PATCH v5 0/2] plugins/cache: multicore cache modelling
- [PATCH v5 1/2] plugins/cache: supported multicore cache modelling
The first series, (plugins: New TCG plugin for cache modelling), along with the bug fixes patches are already merged to the QEMU main tree, the remaining patches are merged to the plugins/next tree, awaiting merging to the main tree, since we’re in a release cycle as of the time of posting.